Bitcoin Price Outlook: Key Resistance Levels and Market Implications for BTC
Bitcoin has exhibited notable bullish behavior over the past month, successfully navigating through several critical resistance levels. Currently, the price is approaching a pivotal resistance zone characterized by the 100-day and 200-day moving averages, which are expected to play a crucial role in shaping the future direction of Bitcoin’s price trajectory.
**Bitcoin Price Analysis: Technical Overview**
*By Shayan*
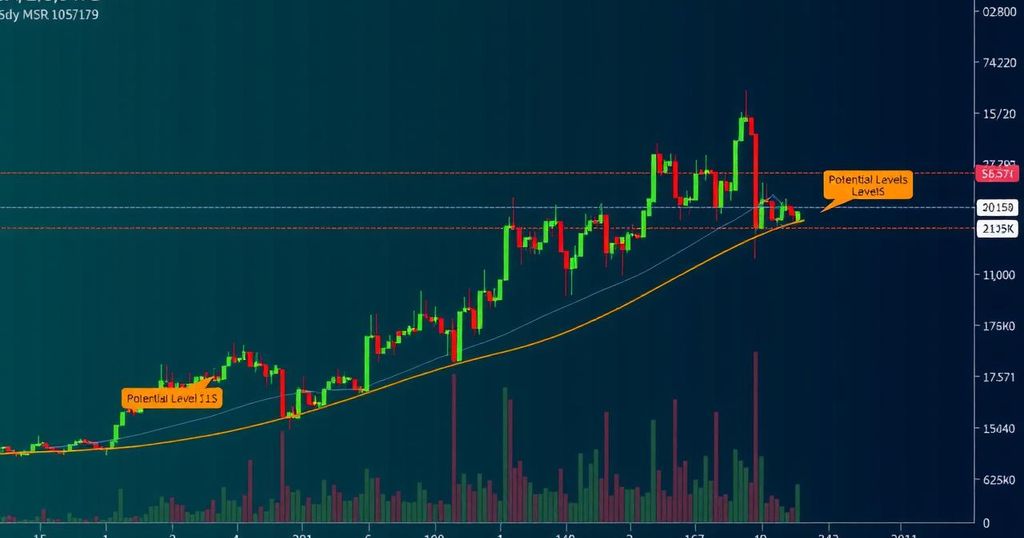
The daily chart reveals a significant uptick in buying activity as Bitcoin underwent a bullish retracement, reclaiming essential resistance levels. Following an impressive rise of approximately 32%, Bitcoin has now encountered a significant resistance zone at $63.5K, where the 100-day and 200-day moving averages converge.
As the 100-day moving average approaches a potential cross beneath the 200-day average, recent price movements indicate a possibility for Bitcoin to rise above this critical level. Should this occurrence materialize, it may lead to a reversal of the aforementioned moving average crossover. Nevertheless, the convergence at $63.5K highlights the importance of this resistance with future price developments likely to be indicative of Bitcoin’s broader market trajectory. In the event of rejection at this level, sellers could shift their focus towards the considerable support zone at $60K.
On the **4-hour chart**, Bitcoin’s recent price actions showcase a bullish trend, distinguished by higher highs and higher lows, reflecting robust demand within the market. Having reclaimed key resistance levels at $56K and $60K, Bitcoin has also formed a notable ascending wedge pattern that may suggest bearish continuation if a downward break occurs.
The price currently faces resistance around the $63.5K mark, where bullish momentum appears to be waning. This price level aligns closely with the upper threshold of the wedge and serves as a critical barrier. A successful breach above this area may catalyze a movement toward the fair value gap between $68K and $69K, potentially reintroducing selling pressure. Conversely, should Bitcoin experience rejection, buyers may find support along the wedge’s lower boundary near the $62K area.
**On-chain Analysis**
*By Shayan*
Examining Bitcoin’s futures market metrics provides enhanced insights supplementary to conventional price evaluations. A specific focus on the Taker Buy Sell Ratio—a significant indicator tracking buyers’ and sellers’ order aggressiveness—indicates a recent noteworthy decline, reflective of robust selling pressure. However, this ratio has recently begun to recover, registering a slight increase, suggesting that buyers are increasingly attempting to propel Bitcoin’s price above the critical $63K resistance threshold.
If the upward trend in this ratio persists, it could sustain the current retracement phase, potentially resulting in a breakout above the 100-day and 200-day moving averages, thereby paving the way for Bitcoin to approach the crucial $70K resistance region.
In conclusion, Bitcoin’s future price movements appear contingent upon its interactions with pivotal resistance and support levels, particularly the $63.5K zone dictated by the moving averages. Market participants are advised to remain vigilant and employ comprehensive analysis methodologies to navigate the evolving landscape of Bitcoin trading. Caution is advised as investment decisions ought to be based on thorough research and risk assessment.


Post Comment