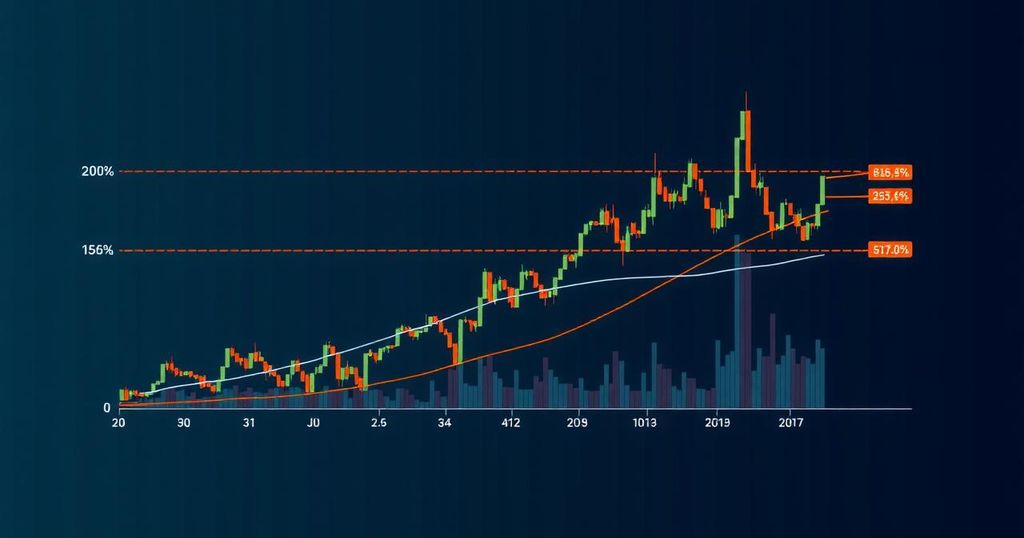
Ethereum Technical Analysis: Current Consolidation Amid Market Volatility
**Ethereum Market Overview: Price Consolidation Amidst Bearish Indicators**
As of September 2, 2024, the price of Ethereum (ETH) stands at $2,517, experiencing an intraday fluctuation within the range of $2,407 to $2,531. This past week has witnessed a price variation from $2,409 to $2,740, highlighting the cryptocurrency’s persistent volatility. Currently, Ethereum exhibits a 24-hour trading volume of approximately $14 billion, alongside a market capitalization totaling $302.85 billion. Nevertheless, the overall market dynamics appear to be under pressure as Ethereum consolidates within a wider downtrend.
The technical analysis of Ethereum’s recent price movements, as evaluated across 1-hour, 4-hour, and daily charts, reveals a sustained downtrend that initiated in late July. Observations from the daily chart demonstrate a consistent decline followed by a consolidation phase in the range of $2,500 to $2,600. A noteworthy observation is the decrease in trading volume, indicating a lack of strong buyer interest during this consolidation period.
The 4-hour chart provides further insights into Ethereum’s market behavior, illustrating a pronounced sell-off followed by a phase of consolidation. Key support is noted at levels between $2,390 and $2,420, while resistance is positioned around $2,595, where recent bullish efforts have encountered rejection. Encouragingly, the increase in volume accompanying the latest positive price movement could signal the onset of potential recovery; however, confirmation from the broader market sentiment is still required.
Turning to the 1-hour chart, Ethereum demonstrated a notable recovery from the $2,397 level, rising to $2,538, followed by a minor pullback that reflects cautious optimism within the market. The critical resistance level spans from $2,538 to $2,550, where the price currently stagnates. A breakout from this zone, supported by robust trading volume, could trigger further upward momentum.
Current oscillator and moving average analyses predominantly indicate a bearish momentum, underscoring the cautious outlook. The relative strength index (RSI) remains neutral at 42.1, while the commodity channel index (CCI) at -100.8 suggests a potential buy signal. Conversely, the momentum oscillator and moving averages, specifically the 10, 20, 50, and 200-period averages, predominantly signal a sell, reflecting the overarching downtrend in Ethereum’s recent price behavior.
**Bullish Outlook:**
Despite the existing bearish indicators, Ethereum’s capability to maintain its position near crucial support levels, coupled with the recent increase in buying volume, suggest a possible short-term recovery. Should Ethereum breach the $2,600 resistance level with substantial volume, this could indicate the onset of a bullish reversal, potentially enabling a challenge of higher resistance levels approaching $2,800.
**Bearish Outlook:**
Nevertheless, Ethereum’s overall technical perspective remains predominantly bearish, with a majority of oscillators and moving averages signaling ongoing downward pressure. The lack of robust buying interest combined with the continuation of the downtrend indicates that Ethereum may face the potential for further declines. Failure to surpass the $2,600 resistance coupled with the loss of support near $2,400 could precipitate a more significant sell-off, resulting in lower prices in the near term.
In conclusion, Ethereum investors should remain vigilant in monitoring market conditions and technical indicators to navigate the complexities of the current market landscape. For continuous updates and to receive weekly price analysis reports directly to your email,
** Weekly Technical Analysis Report
**
Please share your insights and opinions regarding Ethereum’s market performance in the comments section below. Your perspectives are valuable to our ongoing discussion.


Post Comment