Critical Price Levels for Bitcoin: Monitoring the $55K Threshold and Beyond
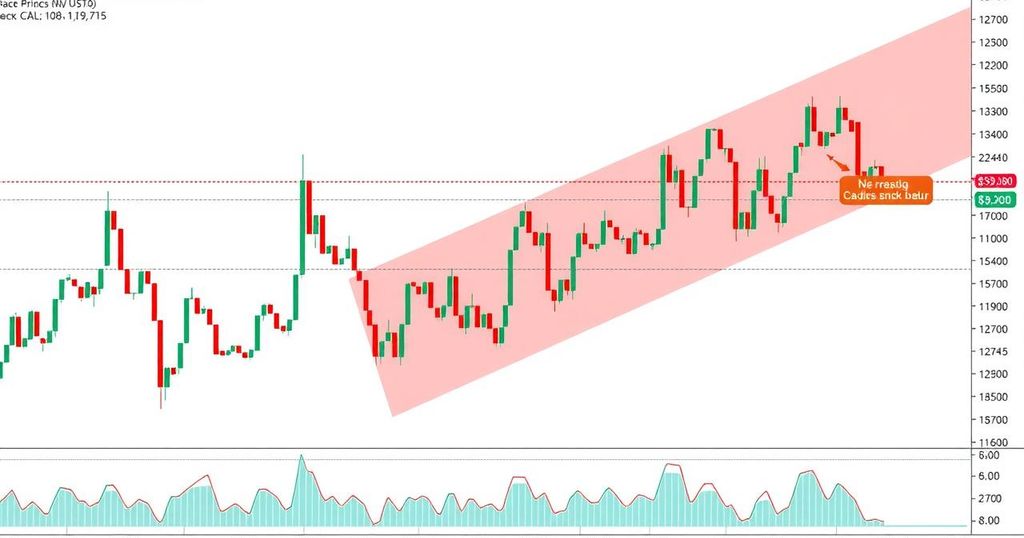
In the current analysis of Bitcoin’s market dynamics, particular attention must be given to critical price levels below $55,000 that are likely to serve as support zones and potential areas of rebound for the cryptocurrency. The recent price action has seen Bitcoin reach a swing high of $57,400 on the 1-hour chart, after a monthly low of $55,250 recorded on September 6. Notably, Bitcoin has interacted with a previously untapped demand zone that originated in August, which may facilitate a subsequent upswing towards $57,500.
Furthermore, a bullish divergence between Bitcoin’s price and the Relative Strength Index (RSI) was noted, evidencing potential for recovery as observed on the 4-hour chart dated September 4. Historically, each swing low in September on the hourly chart has resulted in an approximate 4% recovery, suggesting that a rebound could elevate prices to within the range of $57,500 to $58,000.
At the $57,500 mark, one should note the presence of upside liquidation in leveraged positions. As the market has recently absorbed downside liquidity, a restructuring towards a lower high price range could present a viable opportunity for day traders to engage with potential short positions stemming from the liquidity pool.
Conversely, should Bitcoin fail to maintain its standing above $55,000, the risk of further downside becomes considerably pronounced. A daily close beneath this critical threshold would potentially set the stage for a retest of approximately $52,100, which is designated by Bitcoin researcher Axel Adler Jr. as the next proximate target, given it corresponds with the realized price for short-term holders. Additionally, a zone between $50,500 and $53,000 has been characterized by substantial accumulation from major market participants since February 2024.
In scenarios where BTC does not sustain above $52,000, $49,000 emerges as an unprecedented support level. Should Bitcoin breach this critical support, it would encounter significant bearish pressure, jeopardizing its long-term bullish trend. Drawing parallels to the 2021 bullish trend, if Bitcoin were to descend to $49,000, it is expected to retest the 50-week Exponential Moving Average (EMA) in the forthcoming weeks—a support level that has remained unbroken since October 2023. Historically, during the 2021 bullish run, Bitcoin managed to sustain a weekly position above the 50-week EMA, which bolstered further price advancements while simultaneously allowing the RSI to stabilize around the 50 level, a phenomenon currently replicated in the market.
In conclusion, as echoed by Arthur Hayes, should Bitcoin experience price action leading it to stabilize below $50,000 for an extended duration, this would likely culminate in a weekly close beneath the pivotal EMA level, obstructing its bullish trajectory. Therefore, in anticipation of continued market volatility, it is plausible that a liquidity sweep at the $49,000 level may unfold before a renewed bullish phase is initiated in the market.


Post Comment