John Bollinger Analyzes Bitcoin Price Action and Identifies Bullish Patterns
Summary
Renowned trader John Bollinger has shared critical insights on Bitcoin’s price movements, identifying a bullish W pattern on the weekly chart and the potential for a bullish flag formation. Following significant economic shifts, Bitcoin has experienced a notable increase, with its price showing 10% gains over the past week. As of the latest data, Bitcoin’s dominance has solidified against Ethereum and stablecoins.
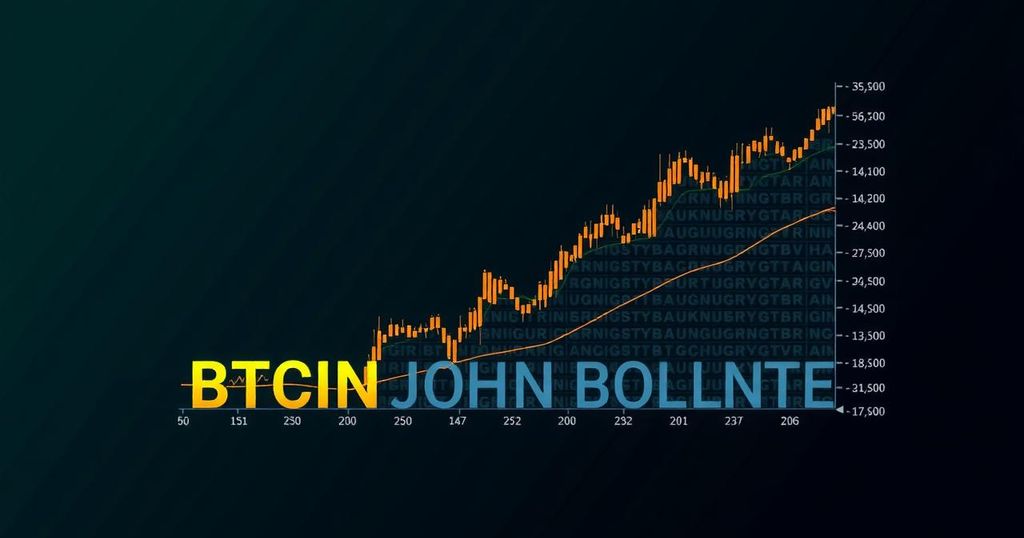
Legendary trader John Bollinger has recently articulated his insights regarding Bitcoin’s (BTC) price movements, leveraging his reputation for creating the well-regarded Bollinger Bands, a vital technical analysis tool in trading circles. In a recent tweet, Bollinger pointed out a W pattern developing on the weekly Bitcoin chart, which suggests a bullish trend. He stated, “Nice little W pattern on the weekly BTCUSD chart. I drew a regression channel to highlight the flag that is forming. Bullish setup, Awaiting confirmation.” The formation of a W pattern, indicative of a double bottom, is widely perceived as a bullish signal and may denote an impending reversal following a prior rounding bottom pattern. Observing the regression channel—an analytical tool illustrating the upper and lower limits of an ongoing trend—Bollinger indicates his keen interest in Bitcoin’s price movements as it operates within this framework. Moreover, he noted the potential formation of a bullish flag pattern, a classic continuation formation that could signify an upward breakout subsequent to a consolidation phase, although he emphasizes the necessity of awaiting confirmation. In recent days, Bitcoin has demonstrated a remarkable performance, with one-week gains reaching 10% after a series of significant economic events impacting the financial markets. The U.S. Federal Reserve’s recent decision to cut interest rates by 50 basis points coincided with a rally in equities, propelling Bitcoin to a high of $64,140. By the time this article was being prepared, Bitcoin experienced a minor decline of 0.63% in the last 24 hours, trading at $63,087, while showing an overall increase of 6.97% in September—a month historically characterized as weaker for the cryptocurrency. Notably, according to IntoTheBlock, Bitcoin’s market dominance has risen by 6% year-to-date, particularly in relation to Ethereum and stablecoins.
Bitcoin has become a focal point of interest in the ever-evolving cryptocurrency market, particularly as traders and investors seek insights that can inform their strategies. John Bollinger, an esteemed trader recognized for his contributions to technical analysis, offers valuable perspectives on Bitcoin’s price action, which is subject to fluctuations influenced by broader economic factors. The mention of patterns such as the W and the bullish flag reflects bullish sentiment in market analysis, providing traders with indicators for potential future movements.
In conclusion, John Bollinger’s recent analysis of Bitcoin highlights a possible bullish sentiment in the current market, characterized by the formation of a W pattern and an awaited confirmation of a bullish flag pattern. His insights suggest heightened interest in Bitcoin amidst a backdrop of significant economic developments, as the cryptocurrency exhibits notable resilience and increasing dominance. Investors and traders may find Bollinger’s observations beneficial for shaping their trading strategies moving forward.
Original Source: www.investing.com


Post Comment