Bitcoin Technical Analysis: Navigating Bearish Momentum and Critical Support
Bitcoin’s price is currently at a pivotal point, stabilizing around $63,682 after a decline from $66,000. Technical indicators point to mixed signals, with potential for both short-term recovery and further decline. Key support at $63,000 is critical, as its failure may lead to prices reaching $60,000 or below. The analysis indicates a cautious approach is warranted given the current market volatility.
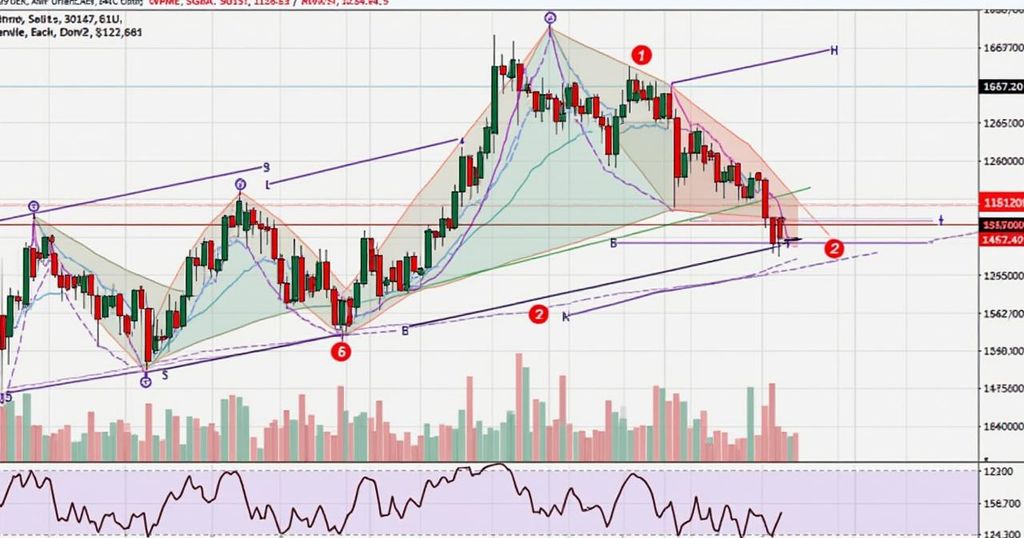
Bitcoin is currently navigating a pivotal moment as its price experiences consolidation following a significant decline from a recent peak of $66,000. As of September 30, 2024, Bitcoin’s price held steady around $63,682, influenced by conflicting signals from various technical indicators. This situation presents a landscape filled with uncertainty for traders, encompassing both possibilities for short-term recoveries and continued declines. The 1-hour chart indicates a strong downward trend initiated after Bitcoin reached $66,071, with the price plunging to as low as $63,259. This decline was accompanied by increased trading volume, suggesting robust bearish momentum. Nonetheless, Bitcoin appears to have found a temporary support level near $63,259, indicating a pause that may precede a potential rebound. Examining the 4-hour chart reveals that rejection from a high of $66,508 has resulted in consistent downward movement, further asserting the ongoing bearish pressure. With elevated selling volume, Bitcoin is now consolidating between the $63,000 and $64,000 range, a critical area previously serving both as support and resistance. Sustaining this level is vital for any chances of reversal; failure to do so could lead to additional losses. From a broader perspective, the daily chart depicts Bitcoin retracing from a stout rally that began around $52,546. The correction phase finds the price hovering near a historically significant support zone at $63,000. A breach of this level may open the door for further declines, potentially targeting $60,000 and $58,000. Long-term investors may view this area as advantageous for entry if signs of price stabilization emerge. The analysis of oscillators reveals a neutral RSI at 56, while the Stochastic oscillator indicates a sell signal at 84, suggesting further possible declines. The overall momentum indicators indicate market indecision, with the commodity channel index and awesome oscillator reflecting neutrality. However, the MACD unveils a potential buying opportunity, indicating that a recovery might occur. The mixed signals from moving averages amplify this uncertainty, as short-term averages indicate a sell signal, while long-term averages suggest a buy. Investors ought to remain attentive, as the interaction between short-term bearish pressures and long-term support levels could shape the trajectory of Bitcoin’s price action. In summary, should Bitcoin maintain crucial support at $63,000, there exists the potential for a short-term rally towards the $64,500-$66,000 region. Favorable indications from longer-moving averages and the MACD could empower Bitcoin to regain upward momentum, offering a strategic entry point for discerning buyers. Conversely, if the $63,000 support fails to hold, further selling pressure may arise, driving Bitcoin’s price to significant levels around $60,000 or even $58,000. The bearish signals from the Stochastic oscillator and the prevailing sell-off volume heighten the risk of a deeper correction, advising caution among traders anticipating immediate upward movement.
Bitcoin, as a leading cryptocurrency, has exhibited volatility in its price movements, often driven by market sentiments and trading activities. Technical analysis plays a crucial role in understanding these movements, as traders rely on indicators and chart patterns to make informed decisions. The recent downturn from a peak price of $66,000 to a stabilizing range around $63,000 signifies a notable selling pressure that reflects market responses to broader economic contexts and investor behaviors.
In conclusion, the current state of Bitcoin presents a mixed outlook driven by both support and resistance dynamics. Maintaining the critical support around $63,000 may enable a recovery towards $64,500-$66,000, benefiting optimistic traders. Nonetheless, any breach below this level may catalyze increased selling pressure, necessitating cautious approaches among investors who are navigating this volatile trading environment.
Original Source: news.bitcoin.com


Post Comment