Bitcoin Price Approaches 200-Day Moving Average: Will History Repeat Itself?
Bitcoin’s price has recently surged past $66,000, approaching the significant 200-day moving average, which has historically indicated the onset of major price rallies. Previous breakouts have resulted in significant gains of over 275%, and market analysts are observing closely if Bitcoin can replicate these historical patterns despite decreasing returns in recent cycles.
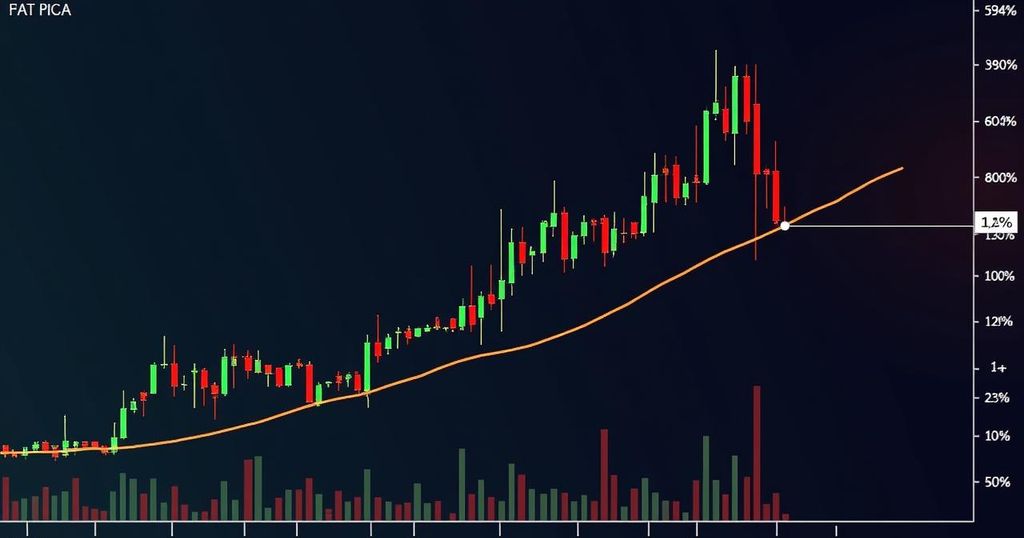
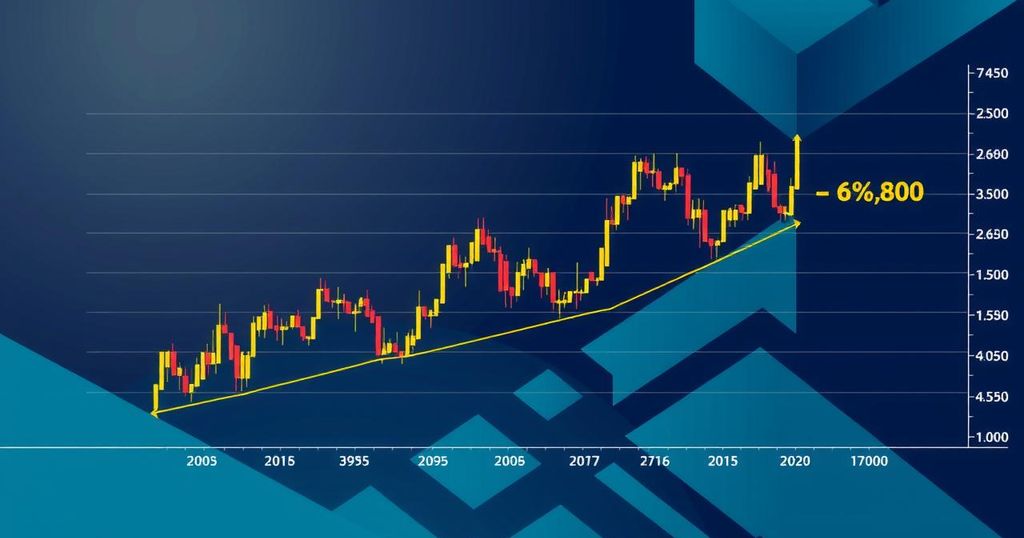
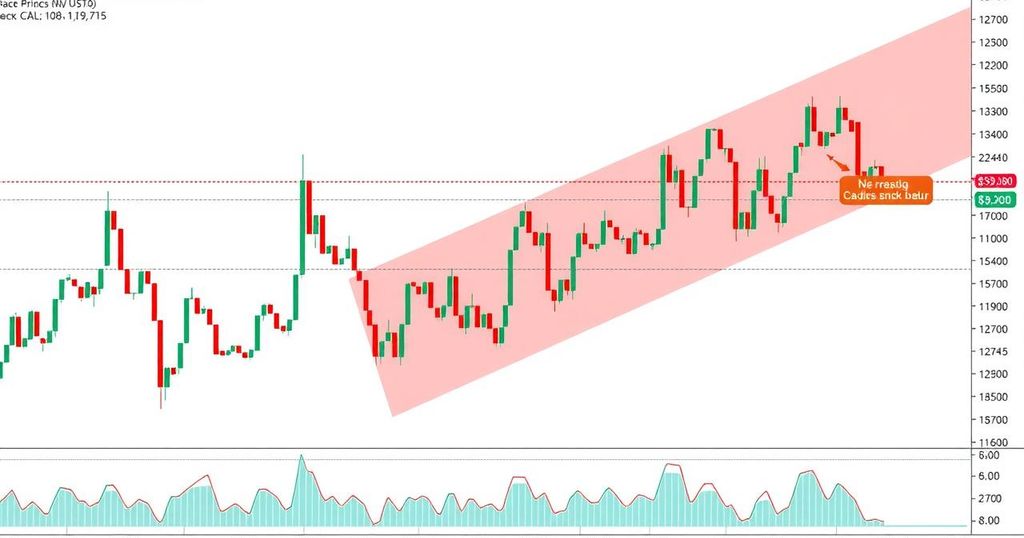
The Bitcoin market commenced the week on a notable upswing, with the cryptocurrency breaching the $66,000 mark for the first time in several weeks after a period of stagnation. This recent pricing surge has brought Bitcoin within striking distance of the critical 200-day moving average (200-MA), a pivotal technical indicator that has historically precipitated substantial price rallies. The 200-day moving average serves as a long-term indicator of asset performance, and surpassing this level signifies a favorable shift in trading conditions compared to the mean over the previous 200 days. Historically, Bitcoin has demonstrated that breaking above the 200-MA can lead to significant bullish trends. Crypto analyst Ali Martinez has noted that in prior instances when Bitcoin’s price exceeded the 200-MA, it consistently marked the beginning of parabolic price surges. Notably, during a breakout in 2016, Bitcoin experienced an extraordinary increase of 7,513% over two years. Likewise, in 2021, a similar breakthrough led to a substantial 705% price elevation, peaking in April that year. The latest breakout in 2023 yielded a commendable 275% surge. Recent market movements have again nudged Bitcoin’s price slightly above the 200-MA, presently located at approximately $65,844, making it a focal point for traders with varying outlooks. As of the past 24 hours, Bitcoin previously peaked at $66,000, albeit with a slight retraction. A sustained confirmation above this threshold would achieve a clear breakout over the 200-MA, potentially initiating another bullish rally. Nevertheless, while the past breakouts yielded remarkable returns, the percentage gains have gradually diminished over time. Nonetheless, even a modest return of 100% to 150% could potentially elevate Bitcoin’s price target between $132,000 to $165,000. The cryptocurrency stands poised for rapid ascension should it successfully breach the 200-day moving average, particularly in light of bolstering institutional interest in Spot Bitcoin Exchange-Traded Funds (ETFs).
The topic discusses Bitcoin’s recent price dynamics, particularly its attempt to surpass the 200-day moving average, which is regarded as a significant technical level in cryptocurrency trading. A breakthrough above this moving average has historically signified a bullish trend, leading to substantial price increases known as parabolic surges. The analysis references previous instances from 2016, 2021, and most recently 2023, each marking the commencement of notable upward price movements when Bitcoin crossed above the 200-MA. This context is essential for understanding the current market conditions and potential trajectories for Bitcoin in light of historical patterns.
In summary, Bitcoin’s recent price movements indicate a critical juncture as it seeks to break above the 200-day moving average, a level that has historically foretold substantial price rallies. Should Bitcoin achieve a sustained price level above $66,000, it could trigger a new bullish phase reminiscent of previous cycles. Despite diminishing returns observed in recent breakouts, substantial profit potential remains as institutional interest continues to grow. Thus, market participants are keenly watching this pivotal moment in Bitcoin’s trading history.
Original Source: bitcoinist.com


Post Comment