Ethereum Technical Analysis: Price Stability Amid Mixed Signals
Ethereum is currently trading at $2,706, consolidating after reaching a high of $2,769. Technical indicators present mixed signals; while the moving averages suggest a bullish trend, oscillators indicate caution. Support is found in the $2,640-$2,700 range, with key resistance at $2,769. A bullish breakout could lead to further gains, while a drop below $2,635 may trigger a deeper correction.
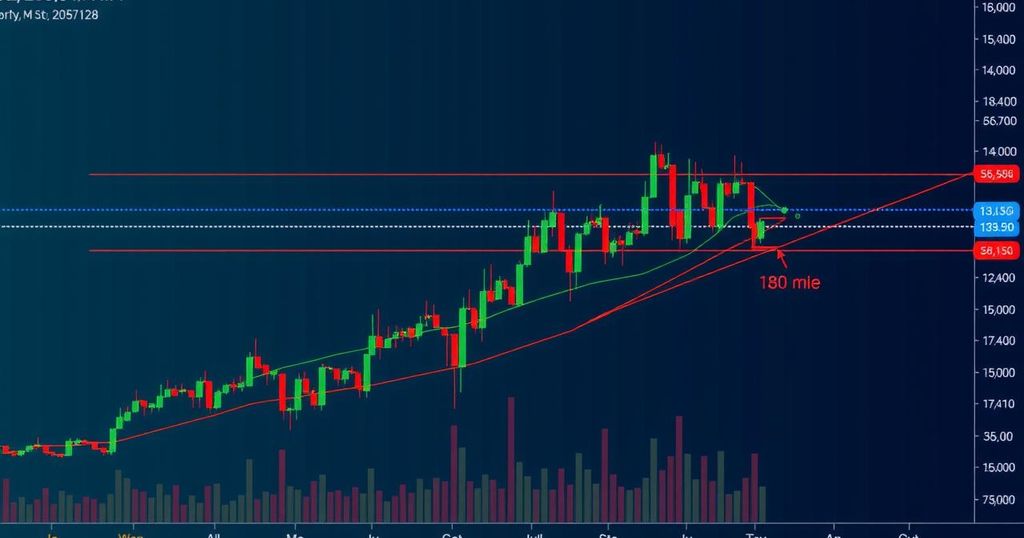
As of October 21, 2024, Ethereum is trading at $2,706, remaining stable within a critical trading range following a recent peak of $2,769. Various technical indicators present a conflicting outlook, with oscillators advocating for caution, while moving averages continue to reflect a predominantly bullish trend. Traders are advised to maintain vigilance for any shifts in price behavior as Ether oscillates between notable support and resistance levels. Examining the daily chart, it is evident that Ethereum’s ascent halted at $2,769 before encountering a slight pullback. The Relative Strength Index (RSI) stands at 63.5, indicating that the market does not currently exhibit overbought conditions. However, the prospect of increased selling pressure looms should prices rise further. Despite a retraction from the recent high, both the 10-day and 20-day Exponential Moving Averages (EMAs) remain above the current price, highlighting a sustained positive momentum. On the four-hour chart, the price retracement becomes more apparent, with multiple downturns following a swift rally. This trend correlates with a high reading from the Stochastic oscillator at 91, suggesting an overbought scenario. Nevertheless, Ethereum is finding critical support within the $2,640 to $2,700 range, which aligns with the 30-period Simple Moving Average (SMA) for this timeframe. The diminished trading volume during this pullback suggests that there may be insufficient selling pressure at present. The one-hour chart reveals a recent decline characterized by consecutive red candlesticks that have propelled the price down to $2,700. Although a minor recovery appears to signal an attempt at stabilization, the Awesome Oscillator remains neutral, indicating that further evidence of a trend reversal is necessary. Concurrently, short-term moving averages, such as the 10-period EMA, are providing critical support, reaffirming the current consolidation patterns. It is essential to closely monitor key technical levels in the upcoming sessions. The $2,640 to $2,700 range represents a pivotal support zone, underpinned by several moving averages. Conversely, the recent high of $2,769 acts as a significant resistance level. A bullish breakout above this price could facilitate further upward momentum, whereas failure to uphold support could drive prices lower to around $2,550. Bullish Outlook: The prevailing technical landscape appears predominantly bullish, bolstered by the convergence of multiple moving averages indicating buy signals and the maintenance of critical support zones. Should Ethereum successfully retain the $2,640 to $2,700 support and gain strength from favorable oscillator readings, a breach above $2,769 may lead to additional gains. Bearish Outlook: Despite the optimistic overall technical view, caution is warranted. The elevated readings on several oscillators, coupled with the waning bullish momentum at recent peaks, suggest potential fatigue in the trend. A decisive breach below $2,635, in conjunction with sell signals from oscillators, could herald a deeper price correction toward the $2,550 milestone or lower.
This analysis delves into the current state of Ethereum’s price movements, focusing on technical indicators that define the market’s trajectory. By scrutinizing various timeframes, investors gain insight into the asset’s resilience and potential price actions amidst fluctuating market conditions. Effective technical analysis employs oscillators and moving averages to determine overarching trends, identify support and resistance levels, and predict future price movements, providing valuable guidance for traders looking to navigate the Ethereum market.
In conclusion, while Ethereum exhibits a generally bullish trend underpinned by robust support levels, traders must remain alert to the potential for volatility. The interplay of oscillators signaling caution against a backdrop of positive moving averages creates a landscape ripe for strategic trading opportunities. Continued attention to critical price levels will be essential for navigating potential breakout or breakdown scenarios.
Original Source: news.bitcoin.com


Post Comment