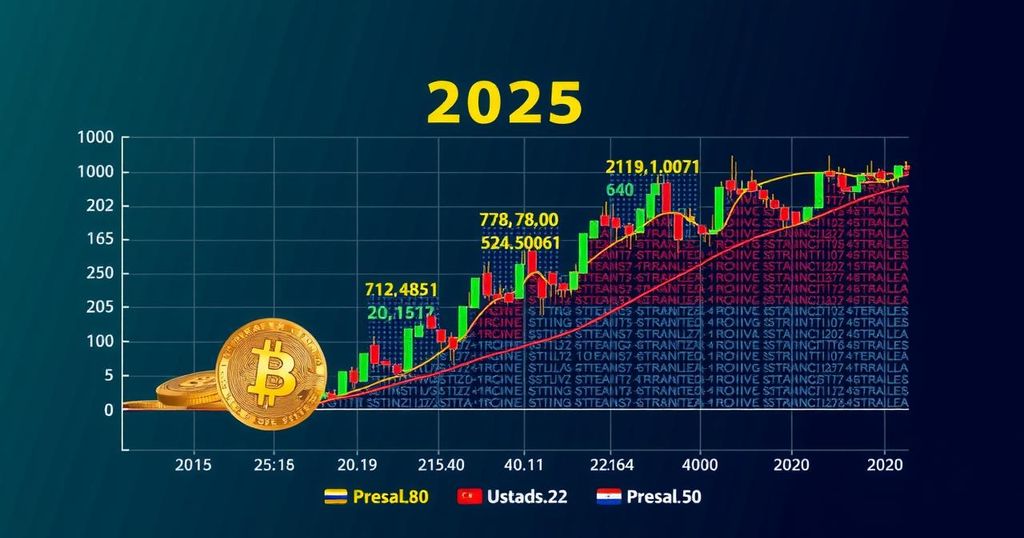
Bitcoin Rainbow Chart Predictions: Key Levels for January 1, 2025
Bitcoin’s recent market performance shows a correction to $93,721 while maintaining bullish sentiment. The Bitcoin Rainbow chart indicates price ranges for 2025, emphasizing significant levels to watch. The ‘HODL!’ zone is key, with potential buying opportunities outlined below key thresholds. Investors must be wary of bubble signals if prices surpass $113,080.8.
The Bitcoin (BTC) market faced some turbulence following November 22, as the price struggled to close the remaining $2,000 gap to reach $100,000. Current trends indicate that despite a drop to $93,721, investor sentiment remains predominantly bullish, with Bitcoin seeing a 36.70% increase over the past month. As Bitcoin approaches the new year, the Bitcoin Rainbow chart emerges as a critical tool for predicting future price actions, especially heading into January 1, 2025.
The Bitcoin Rainbow chart employs a logarithmic growth curve to categorize investor sentiment across varying BTC price thresholds. This chart is segmented into nine distinct zones, ranging from ‘Maximum Bubble Territory’ to ‘Basically a Fire Sale.’ As of November 27, Bitcoin’s position lies within the yellow ‘HODL!’ zone. This suggests that significant price movements in either direction could occur, although the risk of a considerable downturn is diminished unless BTC drops below $83,198.37.
Looking forward to January 1, 2025, crucial price levels are highlighted by the Rainbow chart. The ‘HODL!’ zone is projected to adjust slightly, with Bitcoin anticipated to stay within a trading range of $85,805.72 and $113,080.8. Should the price fall below this boundary, it may provide a valuable opportunity for new investors. Conversely, if Bitcoin exceeds $113,080.8, it would signal potential bubble concerns, particularly for investors who entered the market prior to significant price surges.
Furthermore, potential lower buy-in points are identified at $66,021.85, $50,815.08, and $37,452.43, whereas a drastic decline below $28,494.4 could indicate major market shifts. Investors should also remain cautious of selling opportunities if the price crosses above $113,080.8, considering the increased risk of a market bubble. Holding Bitcoin after surpassing $244,673.38 may be unwise, yet a surge beyond $330,784.01 could invite optimistic projections regarding future valuations, such as Robert Kiyosaki’s $500,000 target for 2025.
It is essential to note that this analysis is based on the updated version of the Rainbow chart, which delineates price ranges for each zone, diverging from the previous method that provided fixed price points. Ultimately, the insights from the chart will be instrumental for investors navigating the cryptocurrency landscape as they consider positions entering into 2025.
The Bitcoin Rainbow chart serves as a valuable resource for assessing the potential price movements of Bitcoin by categorizing its market phases into various emotional states of investors. The chart leverages a logarithmic scale to illustrate price levels alongside corresponding investor sentiment, allowing for a nuanced understanding of how Bitcoin’s value may evolve in relation to market behaviors. Understanding this chart helps investors make informed decisions regarding entry and exit points in their investment strategies.
In summary, the Bitcoin Rainbow chart provides a robust framework for predicting price movements in Bitcoin as 2025 approaches. Its indicators reveal significant price levels to monitor, including the crucial boundaries of the ‘HODL!’ zone. Investor sentiment remains optimistic despite current corrections, with potential buying and selling strategies articulated based on predicted price thresholds. Properly interpreting the chart may present opportunities for strategic positioning in the evolving cryptocurrency market.
Original Source: finbold.com


Post Comment