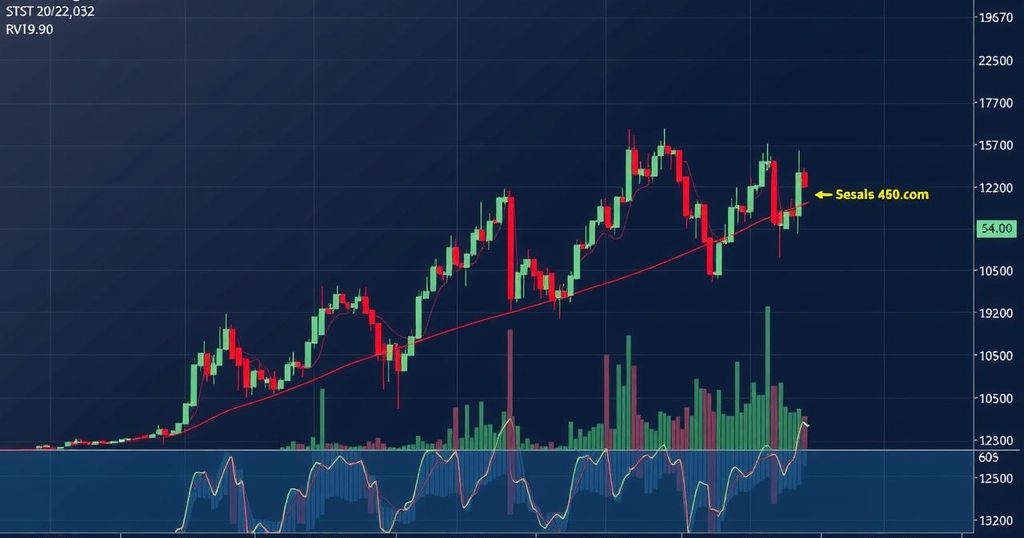
Bitcoin (BTC) Faces Possible 11% Decline Amid Bearish Indicators
Bitcoin (BTC) is witnessing a potential decline, remaining under $110,000 after reaching a previous all-time high. Indicators such as ADX and NUPL suggest a weakening upward trend and a shift in market sentiment, prompting caution among investors. BTC may face a significant price correction unless bullish momentum is restored, with potential targets including $94,000 and $90,000 if downward pressure continues.
Bitcoin (BTC) experienced a significant milestone by reaching an all-time high on December 17, yet it currently trades approximately 5% shy of the crucial $110,000 threshold. Key market indicators, specifically the Average Directional Index (ADX) and the Net Unrealized Profit/Loss (NUPL), signal a deceleration in previous bullish momentum, which may suggest a shift in investor sentiment. Despite remaining within the ‘Belief – Denial’ zone—indicating a sustained degree of confidence—BTC’s inability to break through notable resistance levels raises alarms about potential price corrections in the near future.
The Bitcoin DMI chart reveals that the ADX has receded to 29.2, a significant decline from over 40 just days prior when BTC attained its peak value. This reduction indicates that while BTC’s trend still possesses some strength, its momentum is waning. The prevailing bearish forces may signal an approaching phase of market consolidation or increased selling pressure. With the D+ value at 18.1 and D- at 27.8, it is evident that sellers currently dominate the market. This trend will need to reverse, with buyers needing to lift D+ above D- to potentially revive bullish conditions.
Additionally, the NUPL metric indicates Bitcoin is at a 0.60 level, down from its recent high of 0.628. This downturn reflects a minor retreat in unrealized profits among holders, possibly due to profit-taking behaviors following the recent price surge. While BTC maintains its position within the ‘Belief – Denial’ zone, the existing sentiment shows caution rather than extreme bullishness, remaining above the critical anxiety threshold but presenting room for market apprehension.
Looking ahead, should Bitcoin overcome the resistance level positioned at $103,638, it may garner sufficient momentum to approach its previous all-time highs of around $108,000. A successful breakthrough could enable BTC to finally hit the desired $110,000 mark, further cementing investor confidence. Conversely, if downward trends persist, with EMA lines indicating potential crossovers that suggest diminishing bullish momentum, BTC may test the support levels of $94,000 and potentially drop to $90,000, reflecting an anticipated correction of approximately 11.7%.
Bitcoin, launched in 2009, is a decentralized digital currency known for its high volatility and significant market influence. Recent months have seen unprecedented gains as BTC achieved remarkable price points, reaching new all-time highs. However, such volatility is not uncommon, as market sentiment can swiftly shift from bullish to bearish based on various technical indicators. Understanding these indicators, such as ADX and NUPL, is essential for predicting future price movements and assessing investor sentiment in the cryptocurrency market.
In summary, Bitcoin’s current market scenario exhibits signs of potential bearish trends amidst a backdrop of previously strong performance. Indicators such as ADX and NUPL signal a slowing momentum, prompting caution among traders. As BTC attempts to maintain its standing above key resistance levels, investors should remain vigilant for signs of a correction, with possible targets well below current prices if selling pressure continues. The coming days will be crucial for determining the future direction of BTC.
Original Source: beincrypto.com


Post Comment