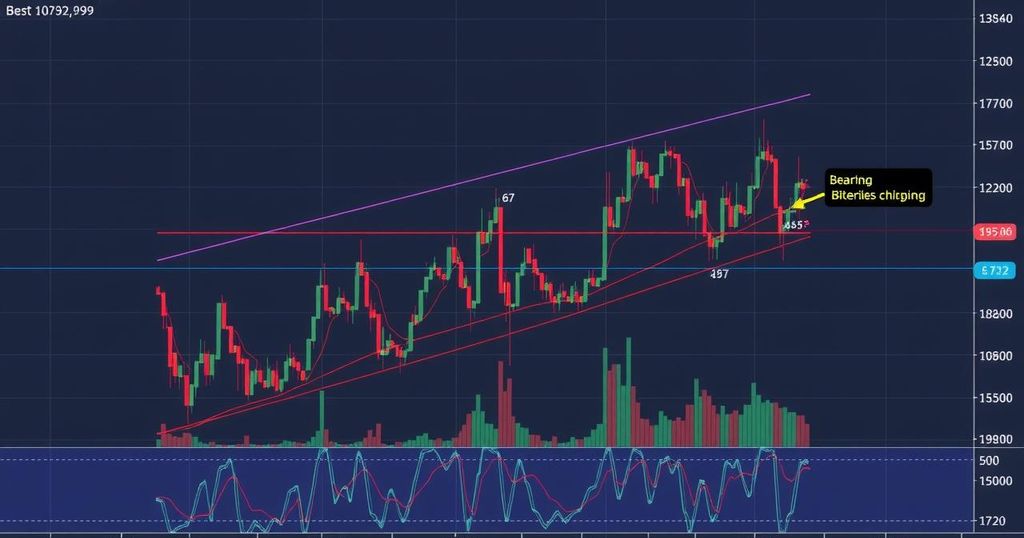
Bitcoin Price Analysis: Bearish Patterns and Possible Outcomes Ahead
Bitcoin is facing potential bearish momentum indicated by a head and shoulders formation identified by analyst Peter Brandt, with a current trading price of $94,162. The digital asset has experienced a daily drop of 0.35% and a weekly decline of 5.55%. Brandt outlines three potential outcomes for its price trajectory: a move below the neckline leading to a selloff, a bear trap resulting in a rebound, or an evolution into a more complex pattern.
Peter Brandt, a noted market analyst, has recently identified a head and shoulders formation in Bitcoin’s chart, indicating a potentially bearish trend for the cryptocurrency. As of the latest data, Bitcoin is trading at $94,162, marking a slight daily decline of 0.35% and a more substantial weekly drop of 5.55%. Market indicators have reflected uncertainty, with bearish exponential moving averages (EMAs) clashing against a minor recovery in funding rates. The present situation raises concerns regarding Bitcoin’s capacity to maintain upward momentum amid prevailing macroeconomic uncertainties.
In a post shared on January 13, Brandt articulated his observations, asserting that a “classic top pattern” is developing on Bitcoin’s daily chart. The head and shoulders formation, which began forming in late November 2024, has its neckline established just above $90,000. Should this pattern confirm, Brandt forecasts a downward target near $75,000.
Brandt delineates three potential scenarios regarding Bitcoin’s next movement. The first posits that if Bitcoin trades below the neckline, a selloff could ensue, driving the price downward toward the $75,000 threshold. Alternatively, this could act as a bear trap, wherein Bitcoin briefly dips below the neckline before experiencing a strong rebound that invalidates bearish positions. The third outcome speculates that this pattern might evolve into a more complex structure altogether.
Currently, Bitcoin has shown a decline of 0.35%, resulting in a total market capitalization of $1.86 trillion. Recent trading analyses illustrate a V-shaped reversal following a false breakdown at the $92,654 support level, with Bitcoin now consolidating near a resistance of $95,119. On the technical analysis front, Bitcoin grapples with challenges posed by bearish momentum.
The 20 and 50 EMAs in the four-hour chart operate as dynamic resistance levels, while a potential bearish crossover between the 100 and 200 EMAs hints at forthcoming downward pressure. The relative strength index (RSI) remains neutral, emphasizing the lack of decisive momentum in either direction. However, contrary to the bearish sentiment, the derivatives market exhibits optimistic trends with open interest increasing by 1.06% over the past 24 hours, totaling $60.53 billion.
Additionally, the long-to-short ratio has seen a minor improvement to 0.9904, with the funding rate rebounding to 0.0085% from a previous low of 0.0010%. Market liquidations recently amounted to $50.45 million, with a significant portion derived from bullish positions. While cautious sentiment prevails among traders, there is a noted resurgence of confidence in long bets.
Despite this cautious optimism in the derivatives market, Bitcoin’s immediate price outlook remains uncertain. The critical support level of $93,739 is likely to face pressure if bearish momentum prevails, and failure to maintain this support may lead to retesting the $92,652 mark. Conversely, a definitive movement beyond the $95,119 resistance could rekindle bullish momentum, possibly propelling Bitcoin closer to the $100,000 milestone.
The cryptocurrency market has been experiencing notable volatility due to overarching macroeconomic concerns that have influenced market sentiment and price action. Subsequently, Bitcoin, the leading cryptocurrency by market capitalization, has struggled to assert significant upward movement. Analysts and traders actively monitor various chart patterns and technical indicators to gauge potential market directions, with formations such as the head and shoulders being pivotal in determining short-term trends. Observing these patterns provides insights into trader psychology and market dynamics, which can significantly impact price movements in the high-stakes cryptocurrency trade.
In summary, Bitcoin is navigating a potentially bearish phase as indicated by the head and shoulders pattern highlighted by Peter Brandt. The current market conditions reflect a struggle in maintaining upward momentum, with critical support levels at risk of being breached. Traders are advised to closely monitor key price levels and market indicators to understand the potential for future price movements, given the mixture of bearish signals and emerging optimism in the derivatives market. Understanding these facets will be crucial for strategic decision-making in the coming days.
Original Source: www.tronweekly.com


Post Comment