Bitcoin Price Analysis: Navigating Key Resistance and Support Levels
Bitcoin remains steady between $94,000 and $95,000, with a slight decline of 5.31% over the week. Analysts are focusing on key resistance levels at $103,000, $106,400, and $108,500, while noting significant bearish risks stemming from a CME gap and potential Head and Shoulders pattern. Critical support levels to watch include $88,000 and $73,000 as market sentiment develops.
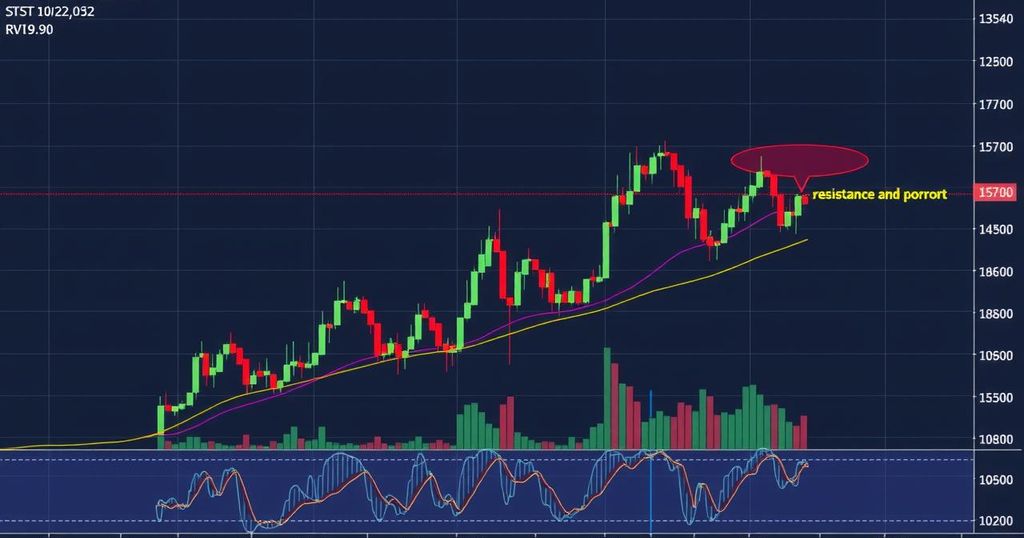
Bitcoin (BTC) has demonstrated stability within the $94,000 to $95,000 range over the weekend. Currently trading at approximately $94,173, it has experienced a slight decrease of 5.31% over the past week. The overall market capitalization remains at approximately $1.864 trillion, while Bitcoin’s market dominance has dipped to 54.2%, indicating a shift towards alternative cryptocurrencies. Analysts are alert to Bitcoin’s performance, especially after it bounced off the 21-day Exponential Moving Average (EMA), a historical support level during consolidation phases.
Should Bitcoin manage to maintain its momentum, analysts forecast potential resistance challenges at $103,000, $106,400, and $108,500. These targets are crucial for establishing sustained bullish activity. Analyst Egrag pointed out these levels, suggesting that a close above $108,500 may indicate continued upward movement. However, despite the optimistic outlook, analysts remain cautious about the recent volatility of Bitcoin’s prices.
Another critical issue to be aware of is the CME gap identified between $80,500 and $77,500, which could signify a bearish target in the event of downward pressure on Bitcoin. Current trading near $94,000 has led to speculation that a decline could result in a correction of up to 18%, necessitating attention to this gap.
Furthermore, prominent analyst Peter Brandt has raised concerns regarding a possible Head and Shoulders (H&S) pattern forming on Bitcoin’s daily chart, indicating a potential drop as low as $73,000. Nevertheless, he advised caution against placing undue emphasis on such patterns due to Bitcoin’s unpredictable nature. Additionally, analytics firm Glassnode highlighted $88,000 as a critical support level, positing that a slip below this price could trigger panic selling.
Bitcoin presently finds itself in a precarious position, balancing between bullish resistance and potential bearish pitfalls. The 21 EMA provides immediate support that could facilitate a rally to the $103,000 to $108,500 zone. However, the existence of the CME gap and the potential H&S pattern presents valid concerns about possible corrections, with critical support levels at $88,000 and $73,000 warranting close monitoring as Bitcoin’s future trajectory unfolds.
The analysis of Bitcoin’s recent price performance reveals critical resistance and support levels, which are pivotal for traders and investors. The identification of these price points, particularly in light of volatility and market shifts, is essential for predicting potential movements. Understanding the implications of technical indicators, such as the 21-day EMA, as well as market phenomena like the CME gap, provides a comprehensive view of Bitcoin’s trading landscape. Analysts remain divided between bullish and bearish sentiments, influenced by both technical patterns and broader market trends.
In summary, Bitcoin’s price is currently engaged in a delicate balancing act between significant resistance levels and potential bearish signals. The 21 EMA offers supportive dynamics, lending a chance for a rally towards higher targets. Concurrently, critical support levels at $88,000 and $73,000 require careful observation, particularly given the existence of past CME gaps and emerging technical patterns. The upcoming days are pivotal for determining Bitcoin’s price trajectory and market sentiment.
Original Source: thecurrencyanalytics.com


Post Comment