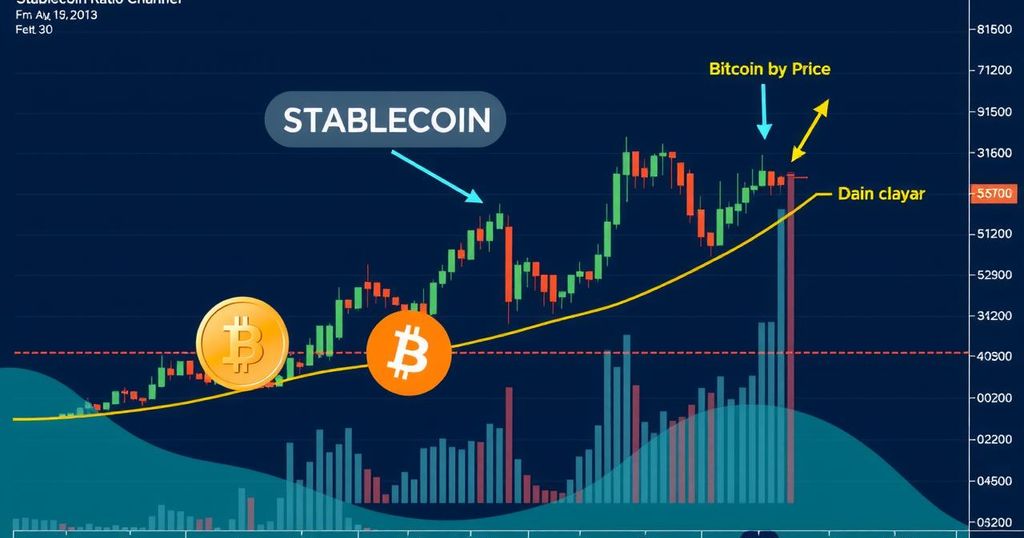
Bitcoin Price Analysis: Market Volatility and Key Support Levels
Bitcoin’s current price stands at $85,288 amid volatility, with significant resistance at $88,000 and support at $76,600. Technical indicators reveal a bearish sentiment, with oscillators showing mixed signals. A breach above $88,000 could indicate bullish potential, while falling below $84,000 may signal further declines. Traders should closely monitor key levels as market conditions evolve.
Bitcoin is currently priced at $85,288 and boasts a market capitalization of $1.69 trillion, with a 24-hour trading volume of $30.19 billion. The cryptocurrency has experienced notable volatility, trading between $84,784 and $87,723 in the past day. Technical indicators across various timeframes predominantly display bearish momentum, suggesting limited bullish activity in the market.
Currently, Bitcoin’s daily chart reveals a consolidation phase following a significant correction from its previous high near $99,508. Critical support is identified at $76,600, essential for buyers to maintain stability. Resistance persists between $88,000 and $90,000, where previous uptrends have encountered challenges. The ongoing decline in trading volume indicates limited buying interest, contributing to market uncertainty; a move above $88,000 could signal bullish sentiment, while a drop below $76,600 may confirm a continuation of the downtrend.
On the 4-hour chart, Bitcoin has experienced sustained bearish pressure, following a decline from a recent peak of $88,772. The immediate support level is positioned at $83,682, with resistance near $88,772. Sellers continue to dominate, as evidenced by consecutive lower highs and minimal buying activity. The MACD level, currently at -590.2, hints at a buying opportunity, yet caution is advised due to the prevailing negative momentum.
The 1-hour chart displays a short-term downtrend, as Bitcoin faces challenges in gaining momentum. Established support is noted at $84,784, accompanied by minor resistance at $87,755. Recent trading behavior indicates dominant selling pressure, with attempts at recovery facing substantial resistance. Given the subdued volume, the likelihood of a strong rebound remains limited; traders should consider short positions on breakdowns below $84,000, while a sustained movement above $85,500 may offer reversal potential.
Oscillators indicate a neutral outlook with a relative strength index (RSI) at 47.3 and a stochastic oscillator at 71.2, reflecting indecision. The commodity channel index (CCI) at 65.3 further showcases a lack of firm conviction. Additionally, the average directional index (ADX) at 22.6 signals weak trend strength. Although the momentum indicator is bearish, the MACD level provides some bullish counter-signal. Traders should seek further confirmation before establishing directional positions.
Moving averages indicate a strong bearish bias, as short-term and long-term indicators present negative signals. The 10-period EMA and SMA are at $85,871 and $85,934, respectively, both suggesting downward pressure. Subsequent moving averages likewise reflect negative sentiment, with only the 20-period SMA at $84,191 suggesting a potential support level. Until Bitcoin establishes a firm recovery, the prevailing sell signals underscore ongoing bearish sentiment in the market.
Fibonacci retracement levels provide additional insights into potential support and resistance points. Bitcoin is hovering near the 61.8% retracement level at $85,350, a critical threshold that could determine future price movements. A drop below this level may lead to further declines towards the $76,600 region. The 4-hour and 1-hour charts report similar retracement levels, indicating ongoing selling control and potential downside pressure. A recovery above substantial retracement points might suggest a reversal in trend.
In conclusion, Bitcoin’s technical outlook remains highly cautious. While oscillators present mixed signals, the overwhelming bearish indicators from moving averages imply a continuing downward trajectory. A decisive breach above $88,000 with strong trading volume could shift market sentiment positively; conversely, failing to hold above $84,000 may precipitate further declines. Traders are encouraged to closely watch key support and resistance levels while remaining flexible to evolving market conditions.
In summary, Bitcoin’s market activity showcases pronounced volatility, with technical indicators predominantly suggesting bearish sentiment. As the cryptocurrency grapples with pivotal support and resistance levels, market participants are advised to adopt a watchful approach. A breakthrough above $88,000 could indicate a bullish shift, while a failure at $84,000 may confirm additional downward movement. Staying attuned to market dynamics will be crucial for traders moving forward.
Original Source: news.bitcoin.com


Post Comment