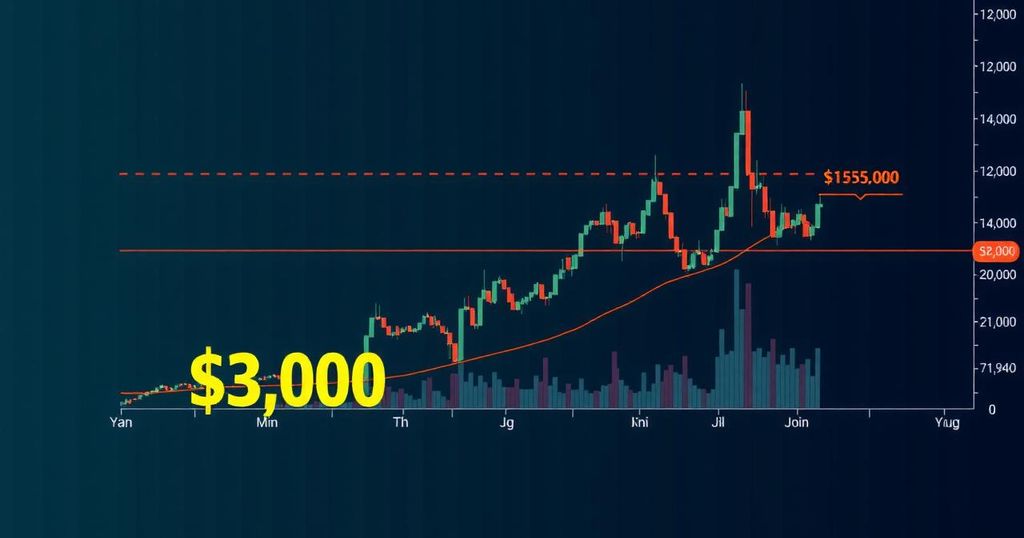
Ethereum Price Analysis: Factors Impacting ETH’s Struggle Below $3,000
As of August 23, the price of Ethereum has settled at $2,700, lagging behind other cryptocurrencies such as XRP and AVAX when considering their performance over the past month. This phenomenon could be analyzed through three technical indicators that illuminate the challenges Ethereum faces in sustaining upward momentum.
In the midst of ongoing uncertainty within the broader macroeconomic environment, the global cryptocurrency market has successfully attracted buyers and institutional investment. Interestingly, while Toncoin and Litecoin have gained traction following news of Russia’s legalization of cryptocurrency, assets like Solana and XRP have benefitted from favorable developments emerging from authorities in Brazil and the United States.
Despite experiencing over $10 billion in capital inflows attributed to the recently launched Ethereum ETFs, the price of ETH continues to struggle to find upward traction. Observations from the price chart indicate that Ethereum has encountered obstacles in surpassing the $2,780 threshold despite numerous attempts since August 14. At the time of this writing, Ethereum is recorded at $2,660, representing a decline of 6% from its previous two-week peak.
While Ethereum’s price remains stagnant, the broader altcoin market is attracting substantial demand, as reflected in the TOTAL3 chart, which illustrates an admirable 5.8% gain during the same timeframe.
A significant indicator of Ethereum’s current struggle is its network usage, which has experienced a notable 35% decline. Current data shows that Ethereum now constitutes 15.07% of the global cryptocurrency market, and a downturn in such a prominent asset could signify internal bearish trends. According to data compiled by IntoTheBlock, the number of active addresses on the Ethereum blockchain has dropped considerably, with only 317,305 unique wallet addresses engaged in transactions as of August 22. This decrease from 487,770 active addresses at the price peak on August 14 indicates a faltering network demand.
The implications of this decline in active addresses are twofold. Primarily, it points to a reduction in network utility and overall demand for Ether. A lesser degree of user engagement in transactions, smart contracts, and interactions with decentralized applications (dApps) culminates in diminished need for Ether, resulting in downward pressure on prices.
Looking ahead, the forecast for Ethereum suggests potential consolidation before a breakout towards the $2,800 mark. The recent struggles correlate closely with the decline in network activity, although Ethereum buyers have shown remarkable resilience in maintaining the support level of $2,600. Sustaining this support could pave the way for a substantial surge in bullish sentiment.
Should the price of Ethereum manage to stay above the $2,600 threshold, there may be opportunities for a rally, potentially solidifying a breakout above $2,800 and setting $3,000 as a longer-term target. Conversely, the technical analysis via the Bollinger band indicator identifies a crucial support level at $2,412, where buyer activity may intensify. A breach below this level could undermine the bullish perspective, though a robust rebound could reinvigorate buying interest, potentially driving the price toward the $2,500 mark.
In conclusion, while Ethereum faces immediate challenges reflected in its current price and declining network engagement, the cryptocurrency possesses the potential for recovery dependent upon stabilizing support levels and improved market conditions. Investors should remain vigilant and conduct their due diligence in navigating these market dynamics.


Post Comment