Bitcoin’s Recent Surge: Analyzing Market Trends and Predictions
**Bitcoin’s Recent Surge: Analyzing Market Trends and Predictions**
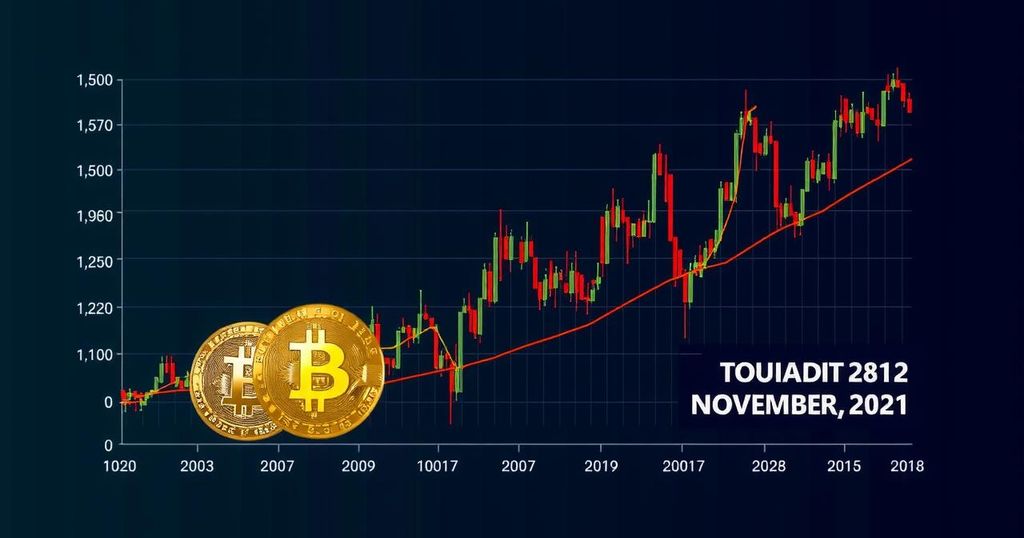
Bitcoin’s value has demonstrated notable resilience in recent weeks, rebounding from a low of $49,000 recorded on August 5, 2024. This significant uptick marks a recovery from a lengthy descending parallel channel that has characterized the cryptocurrency’s price trajectory since its all-time high of $73,072 on March 14, 2023. Throughout this period, Bitcoin has remained within these established resistance and support trend lines, which have shown repeated validation.
The last resistance test occurred on July 29, 2024, with the subsequent test of support plunging to the August low. However, this dip was marked by a long lower wick, indicating a robust buying interest, coupled with a reclaiming of the channel’s support shortly thereafter. Further, by August 23, Bitcoin ascended above the midline of this channel, suggesting the onset of a bullish trend, which has contributed to an impressive 31% increase in its value since those lows.
This recent movement prompts an inquiry into whether historical patterns might guide future projections. Notably, a comparable event transpired from April to September 2023, wherein Bitcoin engaged in a 192-day ascending parallel channel before ultimately breaking out. Currently, Bitcoin has been in a channel for approximately 186 days, mirroring the circumstances leading to the previous rise. Both instances were marked by a failed breakdown below the support trend line, coinciding with bullish divergences observed in the Relative Strength Index (RSI) and the Moving Average Convergence Divergence (MACD).
The technical indicators, including the daily RSI and MACD, are increasingly suggesting bullish momentum, which aligns with the overarching price action. Moreover, wave counts employed in technical analysis indicate that Bitcoin may have commenced the fifth and final wave of a broader upward trend initiated in November 2022. The observed price low in August seems to fit the criteria for a fourth-wave pullback, which sets the stage for potential further gains.
If the upward trajectory persists, target projections suggest that Bitcoin could achieve price levels ranging between $89,200 and $100,400. This forecast is informed by the 1.61 Fibonacci retracement level of wave four, alongside calculations estimating wave five’s potential to match the length of wave one.
In conclusion, while market dynamics remain complex and subject to fluctuation, the current bullish indicators and historical patterns invite optimism regarding Bitcoin’s performance in the near future. Industry analysts highlight the importance of closely monitoring developments within this framework to ascertain the viability of projected price points.
References:
1. CoinMarketCap, Market Analysis 2023.
2. Investopedia, Technical Analysis 2023.
3. TradingView, Historical Analysis July-August 2024.


Post Comment