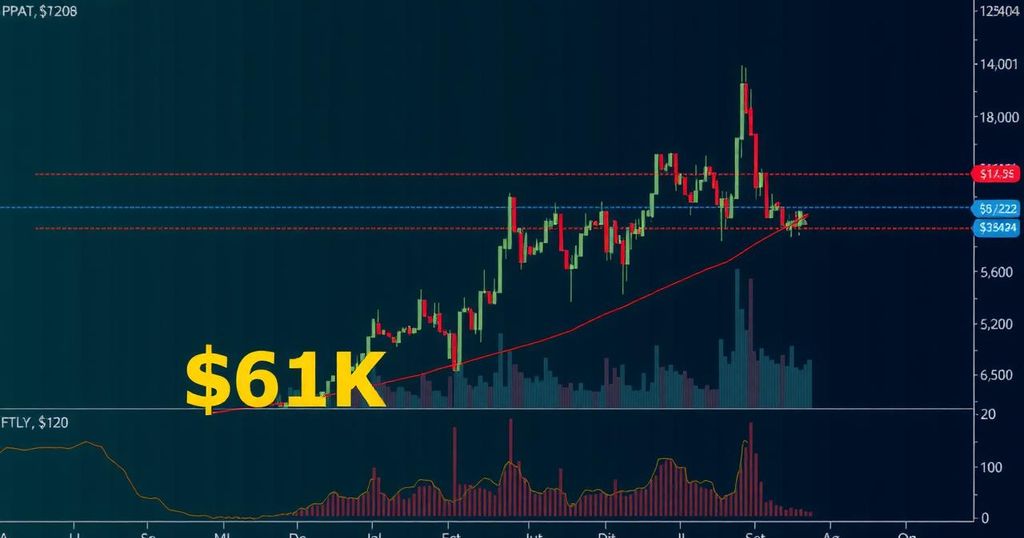
Bitcoin Price Anticipates Recovery to $61K Following Liquidation Declines
Bitcoin (BTC) has experienced a notable correction at the outset of each month during the third quarter of 2024. Specifically, the initial weeks of July and August recorded price declines of 12.56% and 15.94%, respectively. The onset of September appears to follow a comparable trend; however, it is imperative to highlight that Bitcoin has historically demonstrated a propensity for swift recoveries, forming lower highs in subsequent weeks following such corrections.
In the last week, Bitcoin’s open interest (OI) has seen a substantial decline of 12%, dropping from $34.7 billion to $30 billion. In the context of the prevailing market conditions, this reduction is considered a net positive development. An increase in open interest during periods of stabilized prices following abrupt market crashes typically indicates that additional short positions are being established. Since the bearish sentiments were confirmed by several days of negative funding rates post-August 5, the recent decline in OI suggests that those utilizing short leverage may be approaching the exit, awaiting clearer market signals.
Furthermore, liquidations in the market have diminished markedly since early August. Bitcoin’s fall to $49,000 precipitated $1 billion in liquidations; however, these figures have since stabilized, remaining around $150-$200 million, with the exception of August 27, which saw liquidations surpassing $300 million, marking the second-largest event of the month.
The decline in liquidations indicates the possibility of price action stabilizing and forming a potential bottom as leveraged positions exit the market. Bitcoin’s recent dip below $56,000 has approached various liquidation clusters that were also impacted at the beginning of August. Analysis of the liquidation heatmap suggests that this latest decline has eradicated a significant portion of leveraged positions, amounting to over $455 million. It is essential to note that liquidations represent irreversible losses, while liquidation leverage signifies the aggregate value of positions. Thus, a scenario wherein $1 million in liquidations may equate to a positional value of $10 million due to leveraged trading.
Presently, with downside liquidity substantially reduced until $49,000, the forthcoming concentration of liquidation positions appears to be around $61,000, amounting to over $500 billion. Consequently, a short-term rebound now seems feasible. CrediBull Crypto, an independent trader, has indicated a similar outlook following the recent liquidity wicks that were established on August 15. In a recent post, the trader articulated,
“We have now hit my downside target, so hopefully this just means we are now ready for that relief rally sooner rather than later. Nice wipe on OI here, but no immediate signs of buyers stepping in just yet.”
From a technical analysis perspective, Bitcoin’s price movements have not indicated strong bullish momentum post-correction, yet certain conditions suggest the potential for recovery. Initially, a liquidity sweep occurred at $55,700, which has been re-tested since August 15. Should the price fail to rebound immediately, the next prominent support zone is anticipated between $54,500 and $55,500. Additionally, the presence of a bullish divergence between Bitcoin’s price and the Relative Strength Index (RSI) has been noted. While Bitcoin has reached lower lows, the RSI is reflecting lower highs, signaling a possible reversal on the horizon.
Resistance levels remain at $59,914 and $61,144, which are poised as primary targets for any impending relief rally.
It is crucial to note that this article does not constitute investment advice or recommendations. All investment and trading decisions carry inherent risks, and readers are encouraged to perform thorough research before making any financial commitments.


Post Comment